Reliable Bullish Stock Patterns by Tom Monson
The Most Reliable Bullish Stock Patterns – How to Spot Winning Trades
In the world of stock trading, understanding chart patterns can mean the difference between seizing a profitable opportunity and missing out. Among these, reliable bullish stock patterns are particularly important because they signal potential price increases. These patterns often act as roadmaps, helping traders identify the right moment to buy into a stock or market. In this article, we’ll focus on three of the most reliable bullish stock patterns: the Cup and Handle, the Double Bottom, and the Inverse Head and Shoulders. You’ll learn how to recognize these patterns, why they’re trustworthy, and how to use them to make smarter trading decisions. To bring these concepts to life, we’ll also explore real-world examples.
Why Identifying Reliable Bullish Stock Patterns Matters
Bullish patterns are essential tools for traders and investors alike. They form during periods of consolidation or recovery and indicate that buyers are regaining control of the market. Recognizing these patterns allows traders to anticipate the direction of price movement and position themselves for potential profits. While no pattern is foolproof, the three discussed in this article have a strong track record of reliability. They’re widely studied in technical analysis and used by traders to confirm trends and identify entry points.
1. The Cup and Handle
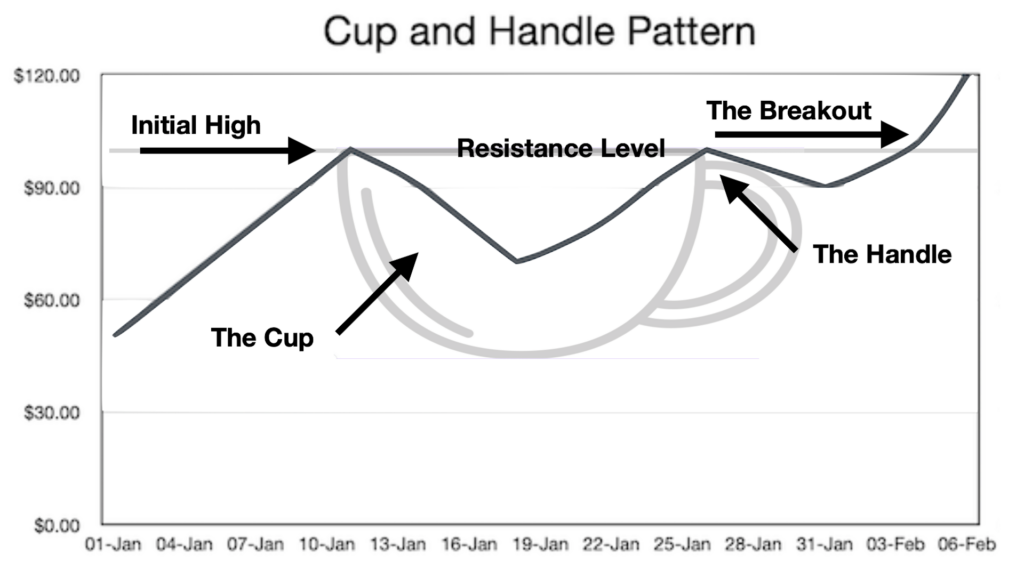
The Cup and Handle is one of the most recognizable and reliable bullish stock patterns. It gets its name from its unique shape, which resembles a teacup. This pattern typically forms during an uptrend, signaling a continuation of the bullish movement.
How to Identify the Cup and Handle
The pattern consists of two main parts:
- The Cup: The price declines gradually, forming a rounded bottom, and then rises back to approximately the same level as the initial high. This rounded shape indicates that sellers have lost momentum and buyers are stepping back in.
- The Handle: After the cup is formed, the price consolidates for a short period, forming a small downward channel or sideways movement. This consolidation is the “handle” and represents a pause before the breakout.
The breakout occurs when the price moves above the resistance level formed by the cup’s initial high.

Why It’s Reliable
The Cup and Handle pattern reflects a healthy market cycle. The rounded cup shows a gradual shift from selling pressure to buying pressure, while the handle indicates temporary consolidation before momentum builds for a breakout. Traders often consider this pattern reliable because it shows clear signs of accumulation.
Example in Action
Take, for example, a stock trading at $50. Over several weeks, the price declines to $40 and then gradually recovers to $50, forming the cup. Afterward, the stock consolidates between $48 and $50, creating the handle. Once the price breaks above $50 on strong volume, traders see this as a buying opportunity. The breakout often leads to significant upward movement, with price targets calculated by adding the depth of the cup to the breakout level.
2. The Double Bottom
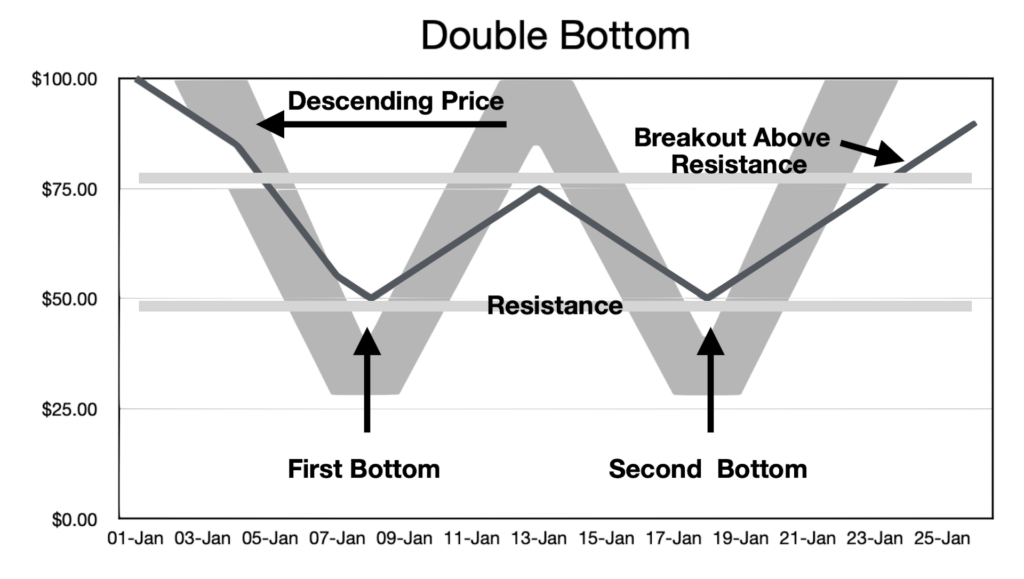
The Double Bottom pattern is another highly reliable bullish signal. It resembles the letter “W” and often forms after a prolonged downtrend, indicating a potential reversal to the upside.
How to Identify the Double Bottom
The Double Bottom has three key components:
- The First Bottom: The price declines to a support level and bounces upward.
- The Second Bottom: After failing to break resistance, the price returns to the same support level as the first bottom. This second dip indicates that sellers are unable to push the price lower.
- The Breakout: The pattern is confirmed when the price breaks above the resistance level formed by the peak between the two bottoms.

Why It’s Reliable
The Double Bottom pattern is reliable because it signals that selling pressure has been exhausted. The repeated test of the support level shows that buyers are stepping in, preventing further declines. When the price eventually breaks above resistance, it confirms that the market has shifted in favor of buyers.
Example in Action
Imagine a stock that has been in a downtrend, falling from $100 to $50. At $50, the price bounces to $70 (the peak) but fails to move higher. It then declines back to $50, forming the second bottom. When the price rallies again and breaks above $70 with strong volume, the Double Bottom is confirmed. Traders use this breakout as a signal to buy, expecting the price to continue rising.
3. The Inverse Head and Shoulders
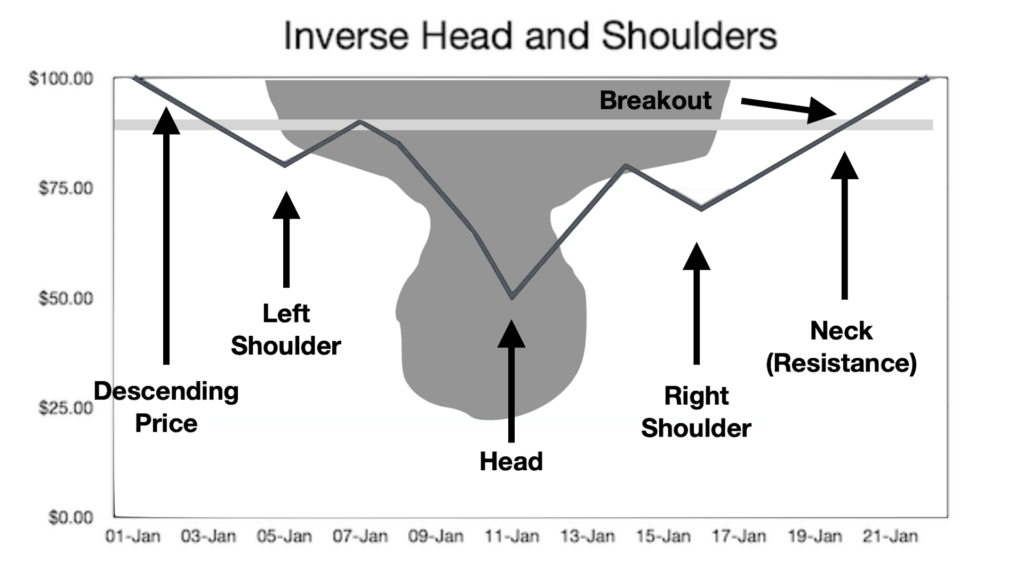
The Inverse Head and Shoulders is a bullish reversal pattern that signals the end of a downtrend. It’s the opposite of the traditional Head and Shoulders, which is a bearish pattern.
How to Identify the Inverse Head and Shoulders
This pattern consists of three troughs:
- The Left Shoulder: The price declines to a low and then bounces upward.
- The Head: The price declines further, forming a deeper low, and then recovers.
- The Right Shoulder: The price declines again but only to the level of the first trough (left shoulder) before bouncing upward.
The neckline is formed by connecting the highs of the recoveries following the left shoulder and the head. The pattern is confirmed when the price breaks above the neckline.

Why It’s Reliable
The Inverse Head and Shoulders pattern is reliable because it shows a clear shift in market sentiment. The head represents the final push by sellers, while the higher low in the right shoulder indicates that buyers are gaining strength. The breakout above the neckline confirms that buyers have taken control, signaling the start of an uptrend.
Example in Action
Consider a stock that has been in a downtrend, falling from $80 to $40. The price bounces to $50 (left shoulder), declines to $30 (head), and then recovers to $50 again. A final decline to $40 (right shoulder) is followed by a strong rally. When the price breaks above the neckline at $50, the Inverse Head and Shoulders is confirmed. Traders typically buy at this point, expecting the price to rise further.
Using Reliable Bullish Stock Patterns in Real-World Trading
Understanding these patterns is just the first step. To use them effectively, traders must:
- Confirm with Volume: Breakouts should occur on high volume. This indicates strong buying interest and increases the likelihood of a successful breakout.
- Set Price Targets: For all three patterns, price targets can be calculated by measuring the height of the pattern and adding it to the breakout level.
- Use Stop-Loss Orders: Protect yourself by placing stop-loss orders below support levels. This limits potential losses if the breakout fails.
- Combine with Other Indicators: Use additional tools like moving averages, RSI, or MACD to confirm the pattern and strengthen your analysis.
Key Takeaways About Reliable Bullish Stock Patterns
Bullish patterns like the Cup and Handle, Double Bottom, and Inverse Head and Shoulders are powerful tools for identifying profitable trading opportunities. These patterns are reliable because they reflect underlying market psychology, showing the balance of power between buyers and sellers. By learning to recognize these patterns and combining them with sound risk management, traders can improve their chances of success in the market.
While no pattern guarantees profits, these three have stood the test of time as some of the most consistent signals in technical analysis. With practice and experience, you can use them to spot winning trades and build a more effective trading strategy. Whether you’re a beginner or an experienced trader, mastering these patterns can give you the confidence to make smarter, more informed decisions.
So, the next time you find yourself staring at a stock chart, remember to look for these patterns. They might just point you toward your next winning trade.
If you want to find out how the pros do it, get Legendary Investors and Stock Pickers:
“Legendary Investors and Stock Pickers is your ultimate guide to mastering the stock market. Learn proven strategies from 12 of history’s greatest investors, including Warren Buffett, Peter Lynch, and Cathie Wood. This book simplifies timeless principles into clear, actionable steps to help you avoid mistakes, build wealth, and invest confidently. Whether you’re new or experienced, this 420-page resource empowers you to create a personalized investment strategy and take control of your financial future. Don’t guess—learn from the best and grow your wealth today!”
Find it in your local bookstore or order it online at AMAZON.


Leave a Reply