Introduction to Stock Chart Patterns, by Tom Monson
In the world of trading, stock chart patterns are like a road map, helping traders navigate the twists and turns of the market. They’re visual representations of price movements that signal potential future trends. Understanding these patterns is essential for anyone looking to make informed trading decisions. Whether you’re a beginner or a seasoned trader, mastering stock chart patterns can provide a significant edge in understanding market behavior.
This first article in the six-part series serves as your gateway to stock chart patterns. We’ll answer key questions: What are stock chart patterns? Why are they important? How do traders use them to predict price movements? You’ll also learn about the two main categories of patterns—bullish and bearish—and how they signal market shifts. By the end of this article, you’ll have a solid foundation to explore more specific patterns in the next parts of the series.
What Are Stock Chart Patterns?
Stock chart patterns are graphical formations that appear on price charts over time. These patterns occur when a stock’s price moves in a way that forms recognizable shapes or trends. Traders observe these patterns to predict future price movements, as they often reflect the psychology of the market—how buyers and sellers are interacting at any given time.
Think of stock chart patterns as footprints left behind by price action. They tell a story about supply and demand, investor sentiment, and potential turning points in the market. For example:
A pattern that shows a series of higher highs and higher lows might indicate optimism in the market, suggesting that prices are likely to rise (a bullish signal).
Conversely, a pattern that shows lower highs and lower lows might indicate growing pessimism, signaling a potential price decline (a bearish signal).
These patterns are universal, applying to stocks, commodities, forex, and even cryptocurrencies. No matter what market you trade in, stock chart patterns are a powerful tool for understanding and predicting price movements.
Why Are Stock Chart Patterns Important?
Traders rely on stock chart patterns because they provide a visual way to interpret market behavior. Instead of relying solely on news or financial reports, patterns offer an objective, data-driven approach to analyzing price action. Here are the main reasons why stock chart patterns matter:
They Help Predict Price Movements
Stock chart patterns are not random. They reflect the collective psychology of buyers and sellers, which tends to repeat itself over time. By recognizing these patterns, traders can anticipate future price movements and position themselves accordingly.
They Provide Clarity in a Noisy Market
The stock market is full of information—earnings reports, news, economic data, and more. Patterns help cut through the noise by focusing solely on price action. They provide clarity and a structured way to analyze the market.
They Are Easy to Use
Once you learn to recognize stock chart patterns, they become a straightforward tool for analyzing charts. You don’t need complex formulas or algorithms—just practice and observation.
They Work Across Markets
Stock chart patterns apply to all types of markets, including equities, forex, commodities, and cryptocurrencies. This versatility makes them a fundamental skill for any trader.
By understanding and applying stock chart patterns, traders gain a clearer picture of where the market might go, allowing them to make smarter, more calculated decisions.
How Do Traders Use Stock Chart Patterns to Predict Price Movements?
Traders use stock chart patterns as a tool for technical analysis. Technical analysis focuses on historical price data and volume to predict future price movements. Here’s how the patterns fit into the process:
Identifying the Pattern
The first step is spotting the pattern on a price chart. Patterns can form over different time frames, from short-term (minutes or hours) to long-term (weeks or months). The key is to look for consistent shapes or trends, such as triangles, rectangles, or curves.
Understanding What the Pattern Indicates
Each stock chart pattern tells a story about the market. For example:
A Double Bottom indicates that a stock’s price has found strong support twice, suggesting a reversal to the upside.
A Head and Shoulders pattern signals a potential reversal to the downside, as buyers lose momentum and sellers take control.
Using Patterns to Make Decisions
Once traders recognize a pattern, they use it to inform their decisions. For example:
A bullish pattern might signal a good time to buy, as prices are likely to rise.
A bearish pattern might suggest selling or shorting the stock to profit from a decline.
Confirming with Other Tools
Patterns are rarely used in isolation. Traders often combine them with other tools, such as volume analysis, trendlines, or moving averages, to confirm their predictions and reduce false signals.
By combining stock chart patterns with other technical indicators, traders can build a strategy that aligns with their goals and risk tolerance.
The Two Main Categories
Stock chart patterns fall into two primary categories: bullish and bearish. Each category reflects a different type of market sentiment and signals distinct price movements.
1. Bullish Patterns

Bullish patterns signal that prices are likely to rise. These patterns are created when demand consistently outweighs supply, pushing prices higher. Traders look for bullish patterns to identify buying opportunities. Common bullish patterns include:
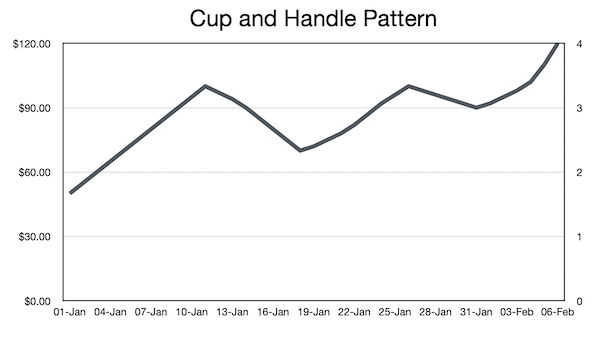
Cup and Handle: A rounded bottom followed by a small consolidation or “handle,” signaling a breakout upward.
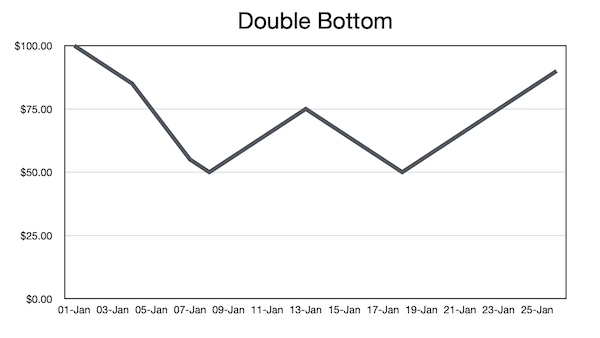
Double Bottom: A “W”- shaped pattern that indicates strong support and a potential price reversal to the upside.
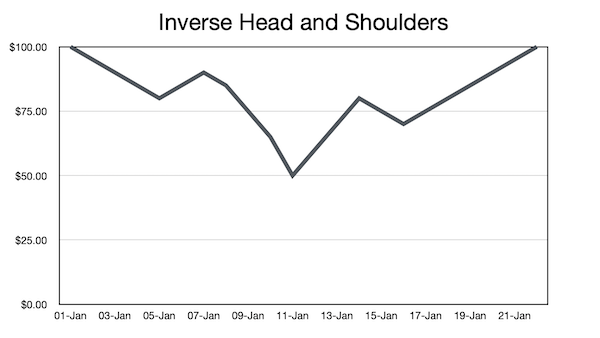
Inverse Head and Shoulders: A pattern with three troughs, where the middle trough (the “head”) is the lowest. This signals a reversal from a downtrend to an uptrend.
2. Bearish Patterns

Bearish patterns indicate that prices are likely to fall. These patterns form when supply consistently outweighs demand, causing prices to drop. Traders use bearish patterns to identify opportunities to sell or short a stock. Common bearish patterns include:
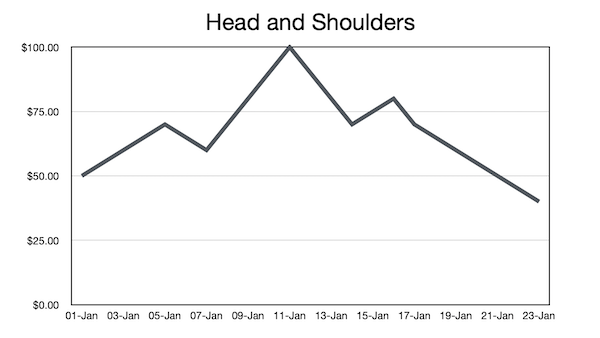
Head and Shoulders: Three peaks, where the middle peak is the highest, signaling a reversal from an uptrend to a downtrend.
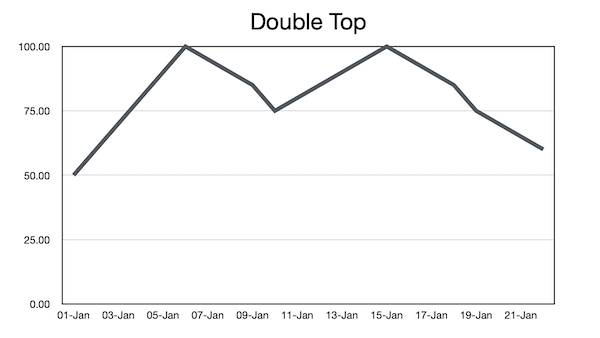
Double Top: An “M”-shaped pattern that indicates strong resistance and a potential price reversal to the downside.
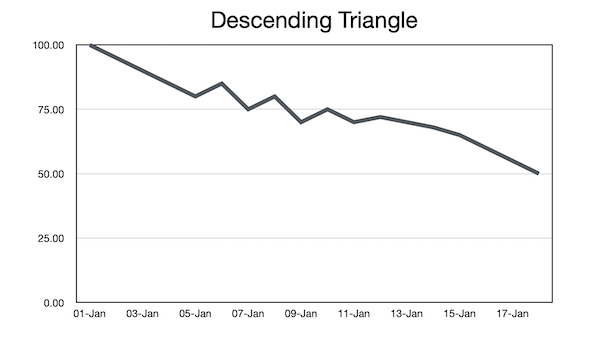
Descending Triangle: A pattern with a flat support line and descending resistance, signaling a bearish breakout.
These categories will be explored in greater detail in upcoming articles, where we’ll break down the most reliable bullish and bearish patterns.
Insights to Gain
Stock chart patterns are more than just shapes on a chart—they’re a window into the psychology of the market. By understanding these patterns, you’ll gain insights into price movements, market sentiment, and trading opportunities. This first article has laid the groundwork, introducing you to what the patterns are, why they’re important, and how traders use them.
In the next article, we’ll dive into the most reliable bullish patterns, showing you how to spot winning trades and capitalize on upward trends. By the end of this six-part series, you’ll have the knowledge and confidence to recognize patterns, predict price movements, and make smarter trading decisions.
Come back and join us as we provide the tools you need to master these patterns to invest and trade smarter!


Leave a Reply